
If you’re of a certain age, you remember what you were doing on election night in 2000. Al Gore was declared the winner around 11pm, or was it Bush? It was too close to call. Back before we did everything on touch screens, NBC anchor Tim Russert kept a whiteboard of the states that were still up for grabs. By midnight, it was clear Florida was the one state that would put either candidate over the top. Russert famously erased all the other states on his board, and wrote, “Florida, Florida, Florida.”
If I were on tv talking about emerging markets, it wouldn’t be too much of an exaggeration to write “China, China, China” on my EM white board. As I mentioned in my post on Monday, the resurgence in production, growth and stability in China over the last year has led a to a very supportive environment for emerging markets assets after a dreadful couple of years. While there are danger signs, the ball could keep rolling for quite a while. How can we assess the risks in China, and build a resilient portfolio accordingly that is robust to the possibility of a hard landing?
I won’t go over all this ground again….you know the drill: China manages the economy and financial markets to maximize the political stability of the regime. China devours commodities like a stray dog set loose on a Vegas buffet. China has capital controls to prevent money from fleeing too quickly. Chinese investors are inflating a property bubble for lack of alternative investments destinations. China has an ever expanding credit stock that the authorities struggle to manage so it simultaneously keeps growth humming while not imperiling the country’s financial stability.
How are they doing on that last one? Our friends at the New York Fed have looked at the data, and determined, you’ll never believe this--China is experiencing a credit boom.
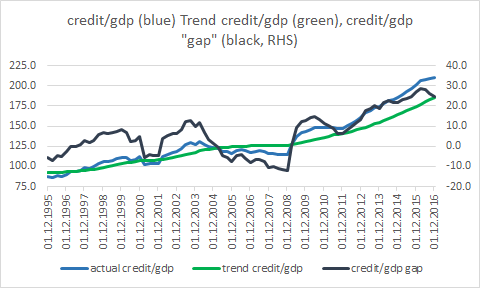
The IMF defines an expansion in credit in an economy as a “credit boom” when one of two criteria are met: 1) the deviation of the annual growth rate of credit/gdp exceeds 1.5x of the trend standard deviation over the past ten years, and the credit/gdp ratio exceeds 10%, or 2) the annual growth rate of the credit/gdp ratio exceeds 20 percent. Without spending too much time abusing the data, China has been in a credit boom since 2012.
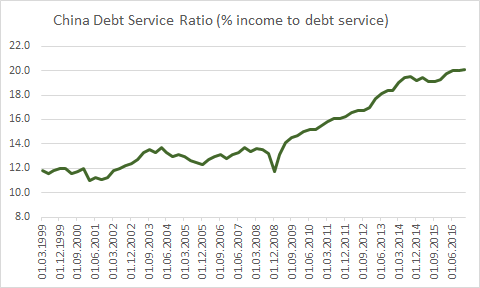
Similarly, the Bank of International Settlements has studied a number of different metrics for “early warning indicators” of a banking crisis. Their data suggests there are two indicators that consistently outperform other measures as “EWIs”. The credit/gdp “gap”, which is the gap between how fast credit is growing relative to a five year trend, and the country’s debt service ratio. The DSR is a measure of what percentage of income is devoted to debt service, or repayment of principal and interest. The higher this ratio goes, the less income there is leftover to spend on, well, anything else.
The credit/gdp “gap” moved into the danger zone back in 2012 and has kept on truckin’ ever since.
As one would expect from an economy with a rapidly growing credit/gdp ratio, the DSR has been on a tear since the post-GFC stimulus measures of 2009--and on an absolute basis, reaching a point where countries have hit the wall in the past.
Also, the BIS notes below that there are a couple of “red lights” for China in their “EWI” analysis--in this measure, DSR is expressed as a deviation from the five-year mean, which illustrates how quickly the ratio has been accelerating. Both the BIS and IMF have noted the more quickly a credit boom expands, the higher probability of an ugly ending.
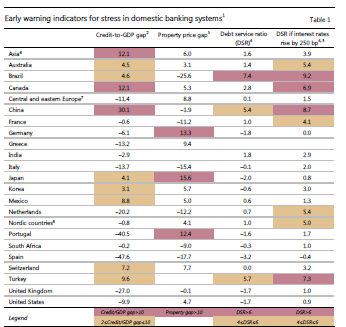
When you add in some aspects of the shadow banking system and credit growth including “nationalized” bank debt taken on by local governments, one can argue the credit “boom” is even larger than the narrow, relatively conservative definitions in the BIS and IMF data.

Alright you say--we’ve heard it all before...nothing to see here, please move along...But what is the probability of an ugly ending? The IMF’s study of the history of credit booms determined there are often two consequences of a credit boom: 1) a financial crisis, and 2) economic underperformance, defined by six years of growth 2% or more below trend, or both.
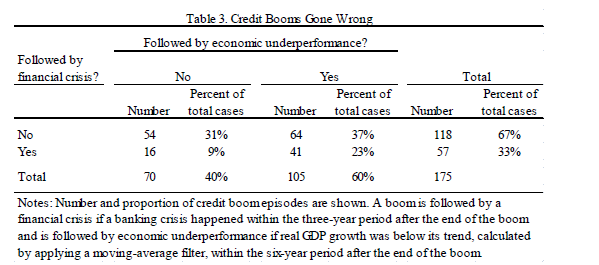
In 69% of cases, one or the other, or both occurred at the end of the credit boom. The paper suggests the other 31% were cases where there were significant financial and structural reforms that caused an increase in productivity, or credit was coming from such a low and underdeveloped level that the credit boom caused the economy to catch up to “normal” levels of credit. China continues to kick the can down the road on structural reforms, and pre-boom credit/gdp ratios were already above 100%, so there is little to suggest the economy is simply developing a healthy credit market.
Whew...ok, lots of numbers there. Given China’s role in global credit expansion and commodity demand, it is clear how and why China is so important to emerging markets, and probably a systemic risk. In the past three years we’ve also seen the delta of Chinese demand to EM financial stability and growth. But the credit data shows nothing much has changed!! The stress, vol, capital outflows and FX deval of 2014-2016 could be better defined as a breather more than any significant deleveraging.
So as a portfolio manager, how do you deal with China risk? Here, I’ll borrow from the esteemed market strategist/philosopher Dylan Grice:
“One problem is that many of the big moves we’re supposed to ‘trade around’ are fundamentally unpredictable “Taleb’s Black Swans), and no amount of research will predict such events. Perhaps a more important thought is that we’re simply not hardwired to see and act upon the big moves that are predictable (Taleb’s Grey Swans).”
The data suggests there is a significant chance, maybe as high as 7 in 10, that China will experience a significant decrease in growth, a financial crisis, or both, in the next five years. Given Dylan’s point above, and well known behavioral biases, do you think that these risks are baked into vol markets that are at historical lows? Me either. But even if it is, it is certainly a “grey” swan and not a black one. The good news is by buying some vol, we’ll pick up protection against completely unpredictable events along the way. Let’s cast the net for some hedges.
Again, with apologies to Mr. Grice, here’s what I think is true about China.
-Chinese credit is expanding fast, and historical data suggests it is prone to disaster
- there’s too much debt there, and probably everywhere else too
-Central banks are likely to react to any credit stress in China with the same elixir: more credit.
And here is what I know is true about China:
-There is plenty of uncertainty--There are smart people that think China has the resources to recapitalize the banking system and/or high enough domestic savings to weather a credit storm.
-a financial crisis or significant decrease in current and future growth expectations would cause a spike in volatility in emerging markets.
-We have no idea when.
Given these constraints, and our hypothesis that the market is underpricing long-term risk of a China driven calamity, we want to use volatility to build in some EM and commodity sensitive hedges which will 1) give some gamma and upside to capital flight or a metastasizing crisis should property and/or credit markets turn ugly quickly, and 2) give us more staying power in long-side trades we’ll need to make our PnL budget if we waiting for Godot (finally, that intro to drama class I took freshman year pays off).
We’ll get into the long-side carry trades another day. Here are a few ideas for hedges in what is by no means an exclusive list.
It is no secret Australia has huge exposure to Chinese demand. The price of this ATM 5y5y AUD receiver swaption is about 48bps per year. The black line below shows just how far through previous lows Aussie swaption vol has fallen. The red line represents the 5y5y rate, which is nearly 100bps off the lows from last year.
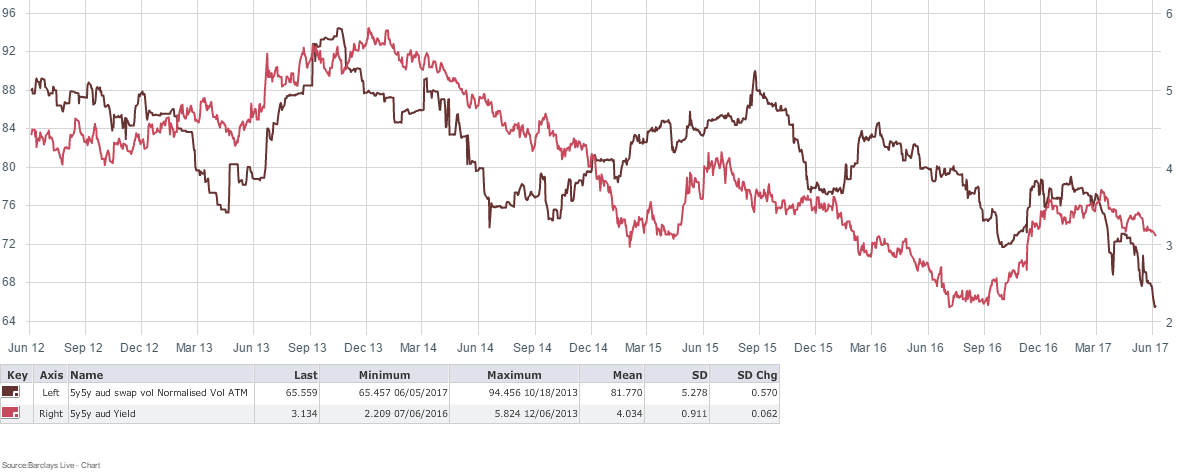
CAD receiver swaptions would likely offer good value as well for the same reasons.
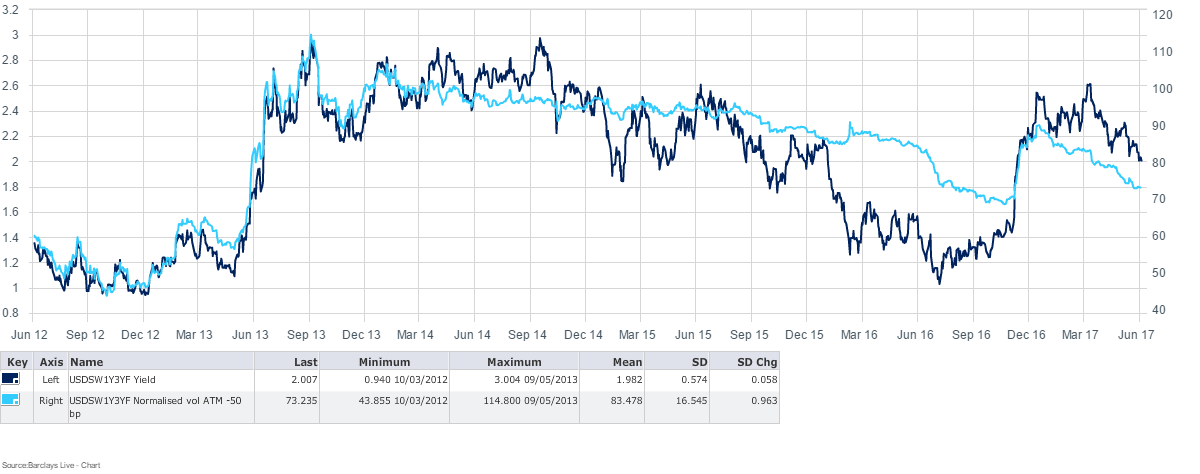
The flattening of the USD curve this year has unwound virtually all hikes by the Fed beyond this year. In a Chinese hard landing the curve could invert as the market prices a return to ZIRP. The price of this 3y- 1y USD receiver swaption would be around 12 bps per year for three years. The chart shows US rate vol isn’t quite as cheap as some other hedges but it is a liquid and straightforward way to gain exposure to a reversal in the Fed’s tightening cycle.
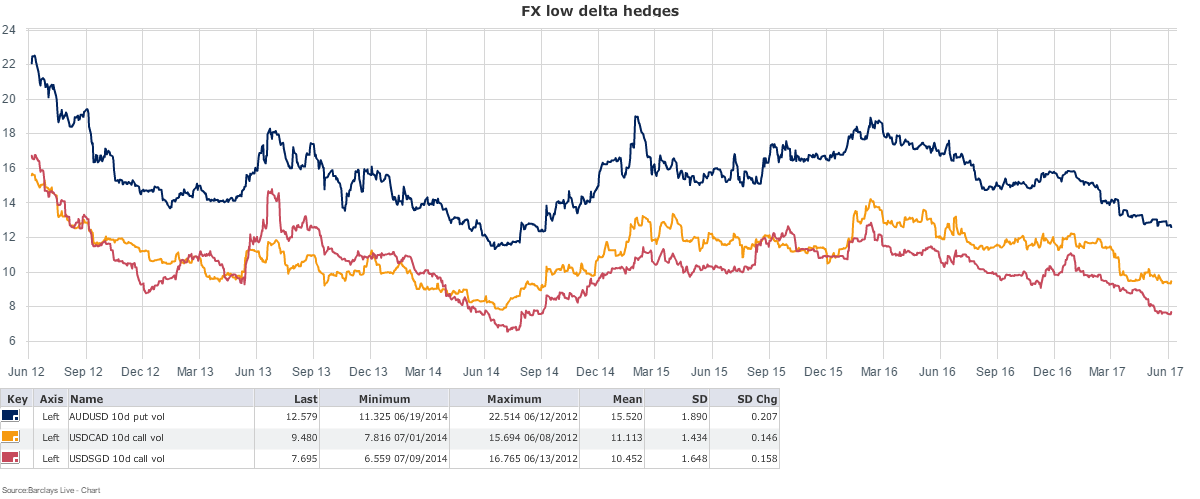
In the FX world, we can grab some low delta put options on China-exposed currencies. We’ll use AUD and CAD again, and add in SGD, which has very low rates and trades like a basket of Asian currencies dependent on Chinese demand.
This chart represents the implied vols for a portfolio of 2 year, 10 delta USD call options on AUD, CAD, and SGD. The implied vols we see here are through the levels from just before the taper tantrum, and very close to the levels from just before commodity prices in general, and oil prices in particular, started to fall in mid-2014. These currencies will all get pummeled if China rolls over.
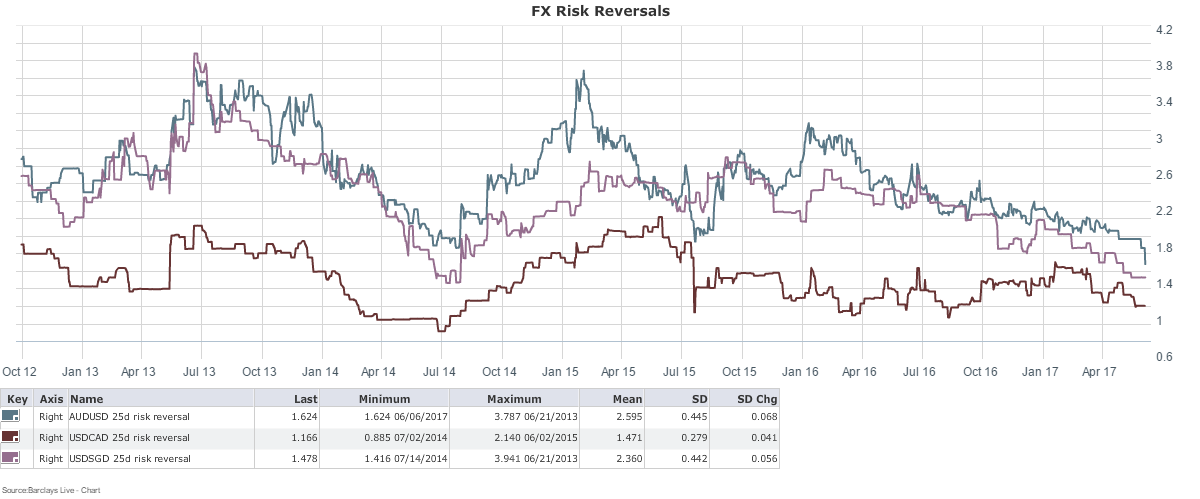
Similarly, 2-year, 25 delta risk reversals have reached some very complacent levels. CAD is scraping along the lows, as is SGD, while AUD is blowing right through. These trades would give you cheap gamma to trade around when and if vol accelerates.
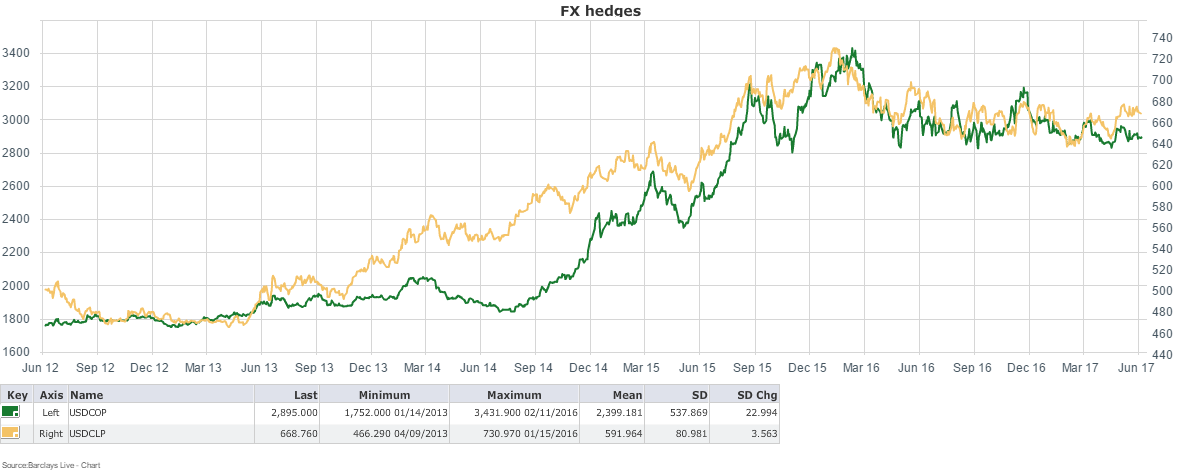
Outright shorts in CLP and COP will give us some reasonably priced exposure to two commodity intensive currencies, with very easy to swallow annual carry of around 3% and 5% respectively. Colombia in particular has structural problems, low real rates, a persistent current account deficit and vulnerability to lower oil prices. Despite this, the currency that has rallied 14% from the 2016 lows. Chile practically begs a macro trader to short its currency given its high dependence on copper prices, significant USD-liabilities in the corporate sector and highly leveraged consumers. Chile also has near zero real yields that will dive to negative territory in a China hard landing.
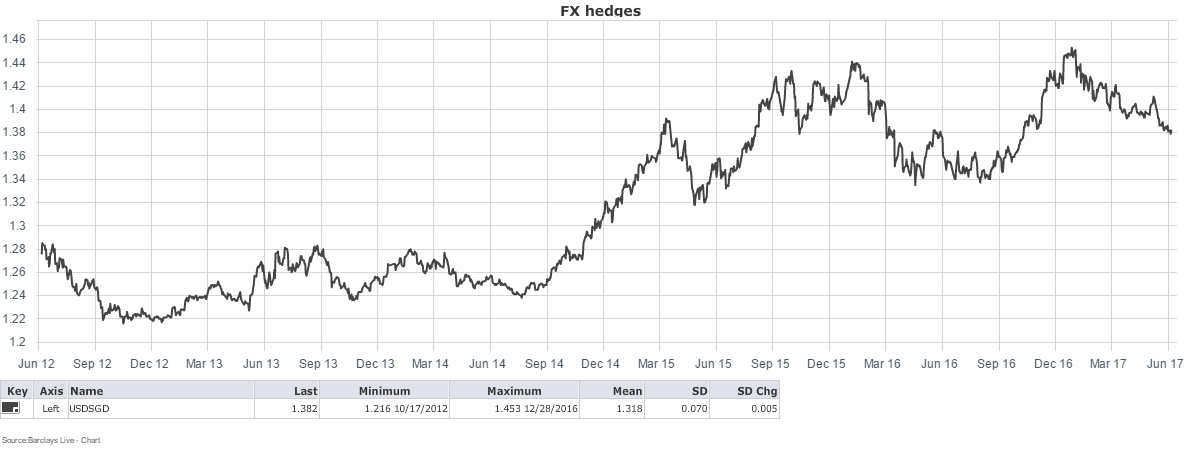
In addition to the SGD puts and gamma noted above, outright short SGD has some merit as well, given its low carry, linkages to global trade and the banking/finance sector.
For the FX option trades we can simply size the premiums to generate negative carry that we are comfortable with relative to overall risk, our PnL budget, or expected positive carry and rolldown, whatever metric works the best. The outright shorts are a little more complicated since our objective here is to hedge tail risk and build long-term staying power for a broader portfolio. But these long USD positions are attractive on a micro level and will also add some protection against an increase in inflation and a bear steepening of global rate curves.
Putting it all together--we can pick and choose a few of these hedges that are currently on offer at fire sale prices and size our hedge portfolio in such a way that we have significant positive gamma should the bloom come off the EM story’s rose. We don’t know the future--but we can prepare for it. These hedges will manage some of the uncertainty surrounding China and give us the latitude to seek out smart long side trades while preparing for the worst.
Shawn
TeamMacroMan@gmail.com
@EMInflationista
Shawn
TeamMacroMan@gmail.com
@EMInflationista
22 comments
Click here for commentsI like your broad approach to analyzing this...
ReplyPlease fix one thing, though. It's "swaption", not "swoption".
Ha, noted...so we're going with "swap-shun" instead of "swop-shun"? What if you're from Texas?
Reply@Shawn Great post, thank you
ReplyNice one.
ReplyChinese demand for oil and other commodities, as well as electricity usage, may be a more useful index of what is happening in that economy than the um.. "official" numbers. Let's keep that in mind going forward, shall we?
Speaking of oil, we have been banging on an upturned bucket about weak demand, rather like those ever-enthusiastic NYC subway bucket musicians, and have been appreciated just as much by our MM audience. However, with crude plunging 5% on the day, maybe we are going to get more people to listen now? [Although audience "contributions" are likely to remain low].
The prospects for $40/bbl oil notwithstanding, one imagines that this latest down leg in crude oil will now lead to another move down in 5y5y break-evens as the prospects for Trumpflation grow dimmer and dimmer by the day.
Not to blow our own horn, but most of these developments were predicted in our little-noted "trumpflation" post back in the middle of January.
http://macro-man.blogspot.com/2017/01/trumpflation-or-return-of-deflation.html
We promise to be back with a new Bond review, but let's get Super Mario and the UK election out of the way first eh?
Just very briefly, here's what we are thinking about tomorrow's events:
ReplySuper Mario: Too many punters have got ahead of themselves about ECB "tapering", "tightening" or LOL "hiking" (dream on!). With a major bank rescue only recently in the rear view mirror, this is no time for Super Mario to do any such thing. Whatever weakness might recently be manifest in EU fixed income and by extension USTs will be promptly reversed tomorrow, as will any recent appreciation in EURUSD. We see this ECB event as being favorable for govies in general, therefore, in the face of continued weakness in (current and projected) inflation data.
UK Election: Hard to see any result here (sadly) other than a Tory victory and a continuation of T-May as PM. Nonetheless after Brexit and Trump there will be a significant amount of hedges on in GBP and FTSE that will presumably need to be lifted on Friday morning.
So those who have called for a bounce in USD and GBP [especially against EUR] are probably going to be proved correct by Friday morning. Whether a bounce in USDJPY can drive another leg higher in Spoos is anyone's guess…..
Chart watchers will be amused to learn that TLT filled the gap left at yesterday's open EXACTLY today and promptly bounced off that Monday closing level (125.83).
ReplyEveryone loves to hate oil. Draw a line through 50 on WTI, go back a year and you'll see that it's been stuck in a Texas MUD (welcome, Shawn!). While I'll probably get my fingers a bit smelly, I added to my XLE position here as I try to pick the bottom of the trading range. Not a gamble by any means, players are circling the wagons to protect the stops going back to reactionary low of 8/2/16. I am not afraid to be aggresive on XLE as long as the one-year old trading range on the underlying commodity is intact.
Reply@leftback, funny you mention about the "official" numbers in China. Liberty Street Economics wrote about that as well a couple of months ago.
Replyhttp://libertystreeteconomics.newyorkfed.org/2017/04/is-chinese-growth-overstated.html
I have my quarrels with their methodology, but it brought up an interesting point. I've spent so much time assuming "official" numbers in China are suspect, that I've developed a cognitive hurdle to challenge that assumption when presented with evidence to the contrary. That's why I think the credit story is so important--it highlights that you can't put too much stock in growth estimates *on either side*.
on China, intersting podcast from Grant and Anne-Stevenson-Yang on China Evergrand.
Replyhttps://itunes.apple.com/us/podcast/grants-podcast-finance-expert-jim-grant-on-investment/id1207583745?mt=2
on Oil. wtf. I hear you IPA. but these draws are taking some time. Feeling like we may need to test a lot lower before we go higher. I dont have a good feel anymore. I still worry if global demand ever slows this, oil takes a real hit. LB are you talking more about US demand?
China COOKS its books, no secret there. Bloomberg, CNN, Newsweek..just google
Replyhttps://www.bloomberg.com/news/videos/b/cfb8cf1d-0045-43d3-a4fe-9ec80d767d1e
@River--ok, so China massages their data, a fact so consensus even Newsweek knows it.
ReplyIf we are willing to stipulate that point (even if the New York Fed suggests we shouldn't), how does help us make money? The point I am trying to make is that the data we are given, which is if anything understating the magnitude of the credit boom, argues there is an increasing risk of a bad ending in the next few years. But we have no idea when (or even if!) it will end. In light of this we have to manage our capital accordingly.
@Shawn.
ReplySorry, I was just trying to second what LB had said..."Chinese demand for oil and other commodities, as well as electricity usage, may be a more useful index of what is happening in that economy than the um.. "official" numbers".
OIl short was a rare winning trade from last month (well, that and short aussie retail). Over-bearishness tripped us up. There's little point hedging with US equities while that includes bets against the the 5 best companies in the world.
ReplyThis iran/qatar/saudi business seems quite bearish for oil. The cartel barely holds at the best of times.
Alibaba story worthy of mention. Some of these companies will hold up even if infrastructure and commodity spend falls through a floor. Which in a command economy is unlikely.
Auctions next week on M and Tu of 3s, 10s and 30s will give us another read on demand for USTs.
ReplyCrude holding up for the time being - but the seasonal period of strength is coming to an end, and the long-term trend is lower, along with inflation expectations. You know the rest….
Leftback, crude hit a low in Aug and reached a high in Dec despite seasonals last year.
ReplyIt's an "exploratory committee" day at JWN. Let's see... I and my family own shitload of shares and we are all execs and sit on the board. Why don't we create some noise and put a bid under our increasingly sagging positions which have been cut in half? What a bunch of garbage! You either put a quiet bid together, surprise the market, and try to acquire at an attractive price or get the f*ck out of my way. Watch the stock slice through $40 like a hot knife through butter and retest 6/27/16 low of $35 on absence of any deal soon. XRT will follow.
Shawn, great post! Appreciate the many trade expressions you share.
ReplyA bit short on time here. A few observations on the macro setup ...
I'm seeing more people talking about the Fed starting a balance sheet wind down before a third hike this year. Goldman and Alan Blinder, for instance. If markets are all about liquidity, then that's a big deal. And speaking of liquidity, I've seen some analysis lately suggesting the Treasury's reduced T-bill issuance (and therefore reduced balances at the Fed) pushed a huge amount of dollar liquidity into markets. A resolution to the debt ceiling (maybe August time frame?) would the catalyst for withdrawal of that same liquidity. Once/if those two things happen, we could be looking at a reversal of this 'weak dollar and everything else bid' (gold, equities, duration) regime. Credit where it's due, this line of thinking comes from: http://oldschoolmacro.com/liquidity-mirage-and-the-next-leg-of-the-rally/
Re oil, Wednesday's EIA data was surprising. One data point, so I'm not about change my working hypothesis. Just a couple days ago, Al-Falih was talking about a big impact "by the end of June, in July" and Russian media was saying the Saudis would consider further cuts this summer, if needed. I'm giving these guys the benefit of the doubt. Added to my options position today.
Exit polls hitting the tape ...
-The exit poll shows May's Conservatives falling short of majority
Reply-The Tories are set to win 314 of 650 seats, while Labour is set to win 266 seats, SNP 34 seats: exit poll
rookie question, aren't you supposed to pick up seats in a snap election?
re: t-bill issuance, maybe i'm out to lunch but I didn't think anyone except tenor basis and money market traders worried about this kind of thing. But maybe I'm wrong!
If the fed stops re-investing maturities, they'll know they have to unwind as gradually as possible--moreover, they are under very little political or economic pressure to do so. But to be honest I haven't dug into it too much lately so do relay anything you see, hear, think, etc. on either subject.
Our Treeza has really made a right royal cock-up of this.
ReplyA few ministerial heads are going to roll. Sterling looking a bit "tarnished". (Before MM gets that one in….)
British electorates do not usually like:
Reply1) Unelected prime ministers for whom they didn't vote at the ballot box (Major, May etc…).
2) "Unnecessary" (early, snap, opportunistic) general elections.
3) Shrill politicians of any stripe.
Cable is back…. Vince, that is. GBPUSD, not so much.
ReplyYes, Shawn, "swapshuns" and "inflayshuns" is where it's at, pardner...
ReplyThat's cool and thanks for your information.
Replythank,
gclub
gclub casino online