
Our friends over at Liberty Street Economics are hard at work generating data analysis for inflation nerds the world over. Their latest innovation is what they call UIG, or the Underlying Inflation Gauge. The NY Fed announced they would be building this measure back in May, and yesterday they hit the tape with the current measure and data back into the 1990s.
This is similar to the analysis of PCE revisions done by the Dallas Fed that I highlighted last month, and probably lends some insight into Dudley’s thought process, which I highlighted around the same time. The new UIG suggests that inflation may be rising faster than implied by the sagging core CPI figures of the past five months.
This is similar to the analysis of PCE revisions done by the Dallas Fed that I highlighted last month, and probably lends some insight into Dudley’s thought process, which I highlighted around the same time. The new UIG suggests that inflation may be rising faster than implied by the sagging core CPI figures of the past five months.
To quote the article:
“Consumers, financial market participants, and policymakers are particularly interested in the trend, or persistent, component of inflation. But this variable is not observed, which has resulted in a variety of proposed proxy measures….Among its attractive features, the UIG is derived from a large data set that extends beyond price variables and displays greater forecast accuracy than various measures of core inflation.”
Why does this matter? Is it just another number produced by a bunch of ivory tower eggheads? Again to quote (emphasis mine):
“...the underlying trend in inflation plays a critical role in the conduct of monetary policy. Unfortunately, differentiating between persistent and transitory changes in inflation in a timely and reliable manner is a challenge. Consequently, a large research effort has focused on extracting the trend component of inflation from monthly data releases.”
They even stick up for their own model:
3. What evidence suggests the model is useful?
Compared with core inflation measures, the UIG:
– can use information about subcomponent price changes
from the cross-sectional and time-series dimensions;
– can consider data beyond subcomponent price changes and
incorporate a large number of additional series;
– has outperformed core inflation measures in tests of forecast
accuracy over different time horizons;
– provides a more timely and accurate signal of turning points
in inflation.
Put another way, there are some important bosses at the Fed that don’t think core CPI is doing a good job to discern underlying inflation trends, and they want something better. This is what their intrepid staff came up with. The two time series are “prices-only” and “full data-set”. “Prices-only” is just what it sounds, a statistical interpretation of the CPI data, while the “full data-set” incorporates many of the factors implicit in a financial conditions index, like labor market conditions, ISM variables, money supply/credit growth and financial indices (rates, equities, etc.).
Here’s what yesterday’s print said:
- The August CPI showed a further pick up in inflation from June. In response to the firming of CPI inflation, both UIG measures displayed a rise in trend inflation.
-The UIG measures currently estimate trend CPI inflation to be in the 2.2% to 2.7% range, with both registering above the actual twelve-month change in the CPI.
Not only did trend inflation rise in August, it has been rising much of the year, incredibly moving the opposite direction of headline AND core CPI.
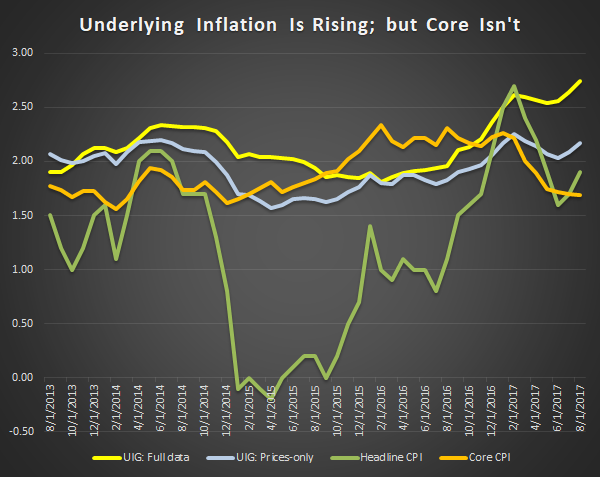
Source: New York Federal Reserve Data
If you’re looking for a reason why Yellen and Dudley see inflation on the horizon, or a reason why they are remaining hawkish despite weaker than expected inflation figures, this is it. Given this data, it is actually rather surprising the term structure of “the dots” flattened as it did….but it also makes you ask: where are Yellen and Dudley’s dots? This argues they are closer to the top of the scatter than the middle. And those two dots are the only ones that matter.
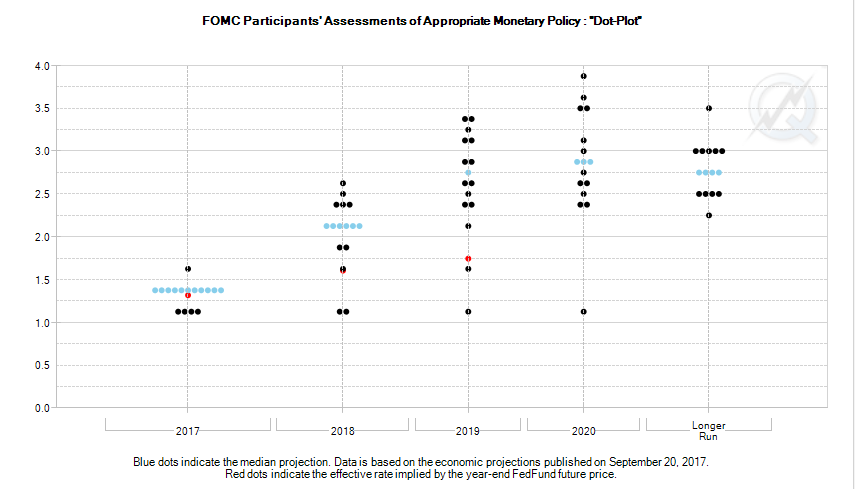
The gap from the red dots (the market) to the higher end of the median dots is roughly 50bps in 2018 and >100bps in in 2019. Clearly the market hasn’t taken in a more inflationary economy--only the more hawkish Fed. You can’t separate one from the other.
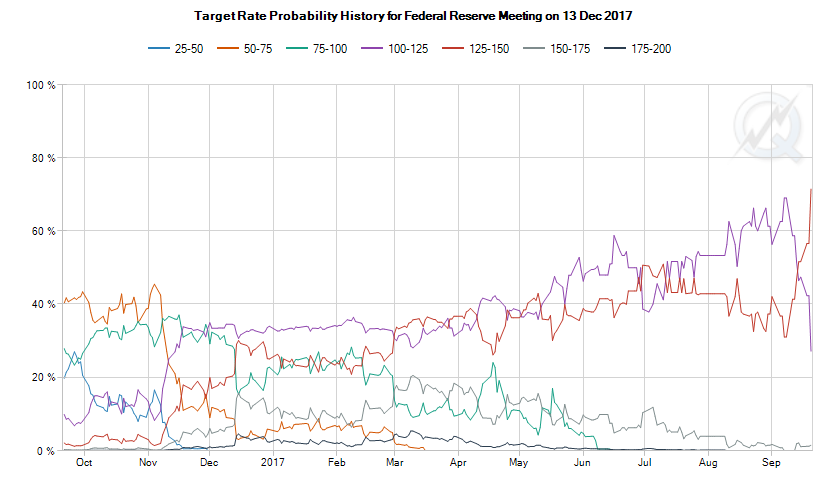
Here’s the probability distribution for the December meeting--the consensus has shifted to a hike:
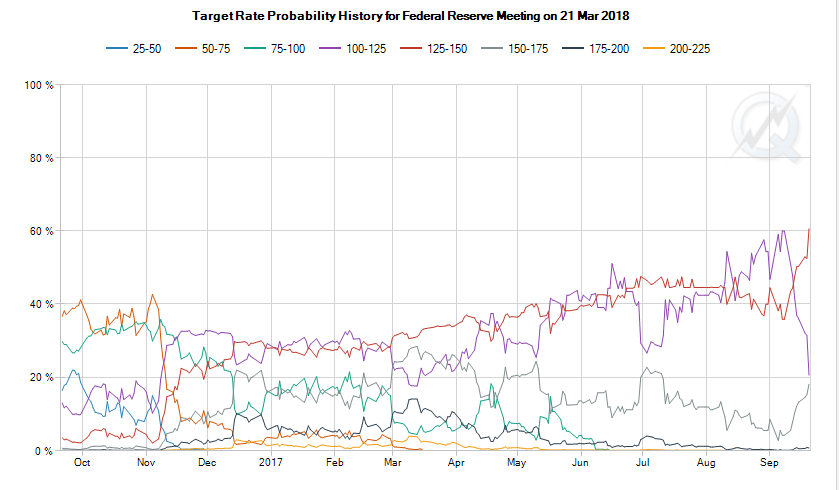
But take a look at the distribution for the March meeting--the probability of two hikes by that time is no higher than it was back in July.
Maybe it is a slow Friday afternoon but the bearish flow in the front end isn’t going away. The front end led the curve higher post FOMC, and even when shorts took some profits this morning, by the end of the day the curve had resumed bear flattening.
This chart shows a proxy for the EDH8/EDU8 spread (orange, 6m3m vs 1y3m) and the EDH8/EDU9 spread (6m3m vs. 2y3m). This serves as a proxy for what is priced
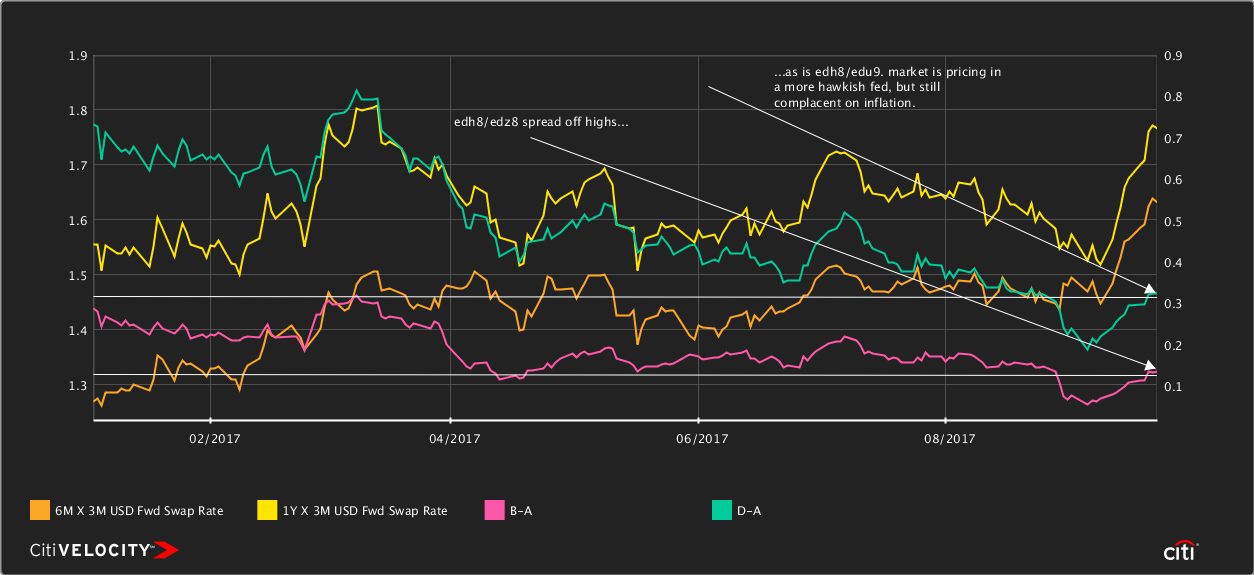
I see those two eurodollar spreads continuing to steepen towards their high back in early July, which would be a move from roughly 13bps to 23bps in EDH8/EDU9, 32bps to 55bps in EDH8/EDZ8.
And yes indeed, that would cause a reversal in the USD we’ve been discussing this week, a conversation that DR got rolling before the market woke up to the FOMC rhetoric on Wednesday....I’m slowly starting to move towards DR’s camp. Yet there is reason to be cautious vs. G10: The WSJ had a good article this morning mentioning that a more hawkish stance from the Fed would give the ECB a green light to start tapering and the BoE to liftoff--so perhaps EUR and GBP aren’t the best choice there--CAD might be in the same camp, where the newly hawkish Poloz is taking no prisoners.
I’ll stick with my long standing bearish view of JPY and KRW, both of which don’t seem ready to rock the boat--I think EMFX could continue to do well if Chinese demand holds up--and I wouldn’t expect the Fed to hike strongly enough to stop global growth momentum--but I do think there’s a reasonable case for a return to rates, curve spreads and fx levels from earlier this year.
Despite the potential for a coordinated tightening of monetary policy, we should expect some convergence in front end interest rate spreads relative to the move in the dollar.
18 comments
Click here for commentsNice catch, Shawn. Thank you for pointing this out. Looking at core CPI m/m sa excl. shelter, I had thought the last print was OK. Neither great nor terrible. But maybe Yellen/Dudley are looking at other inflation "gauges," as you suggest.
ReplySaw a chart of Treasuries held in custody at the Fed for foreign/official accounts overlaying EURUSD. Suggestion is that central banks adding reserves are recycling some of those reserves to EUR. Guess you could look at this and say it's tautological, but if you think of the dollar against blocs, e.g. EM bloc as distinct from Europe bloc, then you could argue: China stimulus => EMUSD up => intervention => buy some USTs (Fed custody holdings up) and buy some EURUSD.
If that causal chain is helping EURUSD (and I'm not saying it's the only reason it's up), then maybe it becomes less constructive before too long given 1) lagged effect from tighter policy in China so far this year, 2) fading effect from the shanty-town renovation scheme and subsidies, 3) general relaxation of investment post-19th Congress, etc..
Seems to be a view (which I can sympathize with) that BoE is going to hike twice and it'll be a mistake. But if that's the case, why is the whole sterling curve steepening? Makes me very reluctant to think of shorting GBP here/now. Barnier comments today weren't terrible either.
Very quickly stopped out of that -EURHUF position the other day. Question. Answer.
sorta interesting graph on the reserve managers point I saw yesterday. The % going to EUR assets has been falling for years. (it is the second chart, I think)
Replyhttps://blogs.wsj.com/dailyshot/2017/09/22/wsjs-daily-shot-will-the-dollar-continue-to-fall/#TheEurozone
But maybe this isn't so much a asset allocation decision by reserve managers as much as it is recycling the assets received in trade flows. Tough to discern one from the other.
Big lag in reporting in the COFER data. Will be interesting to see the next print.
ReplyYou mentioned data from the 90's. The only thing I member from the 90's was Kiddy Busson dancing shirtless singing out loud in some underground French "rave" club...."follow me to this land called victory".....
Replyhttps://www.youtube.com/watch?v=jhpXCoGZrIw
Hey, Kiddy Busson. Your welcome to come on here and give us your fund of funds sector rotation analysis for the week. Your welcome to it.
Replyps.....where was that land again...Australia? LOL
AMZN price is testing neckline of 145-point distance head and shoulders. Ouch!
ReplyBuy some SVXY puts and GDX calls. Equities are not happy here at all.
Here it is - WTI $52 junction, at last. I say up, above, and beyond this time. Not all in one shot, but you know what I mean. Keep an eye on XLE.
ReplyNice call on oil, IPA.
ReplyStopped in EURCHF and USDARS earlier today. Not fun. Was able to cut the former Sunday on the German election news but re-bought lower Monday and stopped on the NK headlines. My guess is a Jamaica coalition doesn't really change the general direction of German policy towards the eurozone, so probably worth getting long again at some point. Just hard to have big delta-one positions given the safe-haven bid we can get in this thing. Back to the drawing board ...
yeah that oil call was solid...as was DR's long USD call (so far!). I mentioned in a sidechat that this German election might give USD a bid, I tend to agree w/ Johno it will be short lived but opens the market to any other usd positive trade winds. Still never a dull moment in US politics...Can I go Long USD/Short NFL? And one other thing...I get it is because of the party colors, but is there anything LESS Jamaican than a German political coalition?
ReplyI'm not much of a chartist, but the weekly DXY over the last four weeks is showing one of those 'pregnant women' things. A green week and it's one of those 'three soldiers' things. Or as a wise man said here last year "it's hammer time" on the monthly. :)
ReplyThat monthly does look juicy but the backtest isn't very exciting, at least for my definition of an hammer -- https://imgur.com/a/4y4H0
ReplyTrying not to get too excited on the dollar here, feel there's better risk/reward in playing it through rates.Holding on to my EDZ7EDZ8. The only real argument I can make for the dollar is GSCI 1y changes pushing inflation up but I can make that for the euro too, as johno pointed out recently.
Also, read this recent report by JDI that makes a very good case for further eur strength.Recent strong improvement in EZ basic balance has been masked by bond portfolio outflows due to very low yields. As mid term real yields picked up recently, mainly in the fwd space, so have these flows and they should now allow for the basic balance improvements to shine. I see little reason for these flows not to continue improving.
@SKR, and an abandoned baby soon to follow :)
Reply@MacroWatcher, are you a mind reader? You bring up an important issue. DXY charts on different timeframes are going to tear traders apart. I for one really wanted to go long on a close above 50 dsma or 8 wema (pick your poison). Been watching a close resemblance to 2009 weekly chart and thinking once the bounce starts it carries through. This being said, I am now starting to doubt it. The inverted h+s it's trading right now is shallow with a distance of only 1.5 points and a projected target of 94. After that I am starting to think it has more downside to explore. The culprit? Monthly chart of Mar 2015 - Today is now looking a lot like Oct 2000 - Jul 2002. Yep, look at that hammer ;)
I was a big dollar bull until I decided to stifle my obnoxiousness and scrolled back to see the inevitable. Even though DXY is in much more different place today and I agree that you can't always draw parallels, one can't deny that future is nothing but a repeat of the past.
@MacroWatcher, I'm with you 100% there, Euroarea c/a surplus (or German export strength, if you prefer) + reduction or reversal of portfolio flows + continued tight fiscal policy + improving growth + REER cheapness relative to USD and CNY sums up to a pretty strong fundamental medium-term picture--that's why I am circumspect until we see a breakdown < 1.17 and/or evidence of diverging monetary policy.
ReplyTough thing about the price action this week is the FTQ bid from the Declaration of War Tweet (on North Korea, not Kapernick), Kurdistan, etc. etc. Seems like that theme ran out of gas this afternoon but we'll see how tomorrow plays out. Don't think Fedspeak is going to change much--several EM central bank decisions could move a few of those pairs though.
Hi MW,
ReplyEDZ7EDZ8 steepener seems OK to me (I would look at the EDZ8 leg with an eye to relative value case for using surrounding months instead). My general thought on US rates is: 1) Yellen/Dudley want to hike to 0%-0.25% real next year and will do so, so long as inflation isn't trending lower; 2) Philips Curve isn't dead but it's so flat (maybe steepens <3% but we're still far from getting there to test that) that it's effect can't be the basis for a trade; 3) a lot of one-offs/noise are probably causing people to over-interpret and expound "inflation is dead" narratives; 4) I see some reversion-to-trend in inflation data from here. Of course, we could have a different Fed Chair and there's always the Chinese economy, which I'm expecting will be at least bit less supportive next year.
This moment, I'm not seeing anything especially compelling in macro. Still think dollar bull market is over, but now isn't the time to press nor get short. My view is Yellen/Dudley may actually understand now (but will never admit) that easy money caused asset bubbles which caused the last two recessions. Asset bubbles are the evil, not inflation, ergo, you have to tighten now to lengthen the economic cycle. Assuming they understand that and execute on it, we get a super long cycle, and low but not negative asset returns. It's hell for anyone who wants to get rich quick in a bubble of systemically-large proportions or off volatile markets, but good for keeping marginal workers in the workforce.
+USDJPY is probably OK. The Fed wants to hike real rates, inflation likely to moderately mean-revert (but nothing to cause a term premium panic), QE effects (Fed reduction, plus ECB tapering which grows likelier with USD strength/hawkish Fed), out-of-whack with global PMI high. Carries positively. Fly in the ointment is North Korea. So far, have to wait <24 hours for those headlines to get reversed, but ... what happens if a US plane is shot down next? This is the one thing keeping me from shorting gold right now.
Good editorial by Munchau in the FT today on the German election. This German election is a bummer for the Europe trade, though I still like CAC vs SPX. I love the contradiction of Europe-haters -- "it's terrible," they say, but if it's so terrible then the smallest change in the right direction (as with French labor and tax reform) should be very significant.
Everyone seeing this research about how 4% of stocks deliver all the gains? Now, imagine that narrative becomes popular like "stocks for the long run" in the late-90's or "safe as houses in the mid-00's"? FANG could go a lot higher, esp when GOOG and AAPL are cheaper than the Russell (the Russell being that collection of "the other 96%").
You want to know what dog stocks look like.....go no further than Crown and Hilton casinos.
ReplyGuys, I'm not really sure how to respond to the above posts - I suppose thank you would be apt.
ReplyI do however feel impelled to say that anyone who wishes to do a backtest of my views (and songs) over the past 18 months, is more than welcome.
Anyhow, in my eyes we are all friends here, so it does take all sorts.:)
Sure Skr, didn't mean nothing more than just share something I found interesting. Didn't want it to come across like some criticism, the market is a judge tough enough, we dont need each other :)
ReplyBy looking at that monthly chart it does look quite a bit like 2002, as IPA said. No position though, just sitting and watching now. I share the view that there are no really compelling macro trades as of now.
So finally tax reform is announced. Why is the top individual rate going down? Political suicide. Why no details on how the cut would be paid for? Because there is no way without BAT and it's dead. I get the potential growth = more revenue, blah, blah. Nice assumption. I ain't the one they have to sell this to. No Dems will back this up unless the top rate stays put. Rep budget deficit hawks will not either unless it's revenue neutral. Sausage making begins. Gonna be ugly just like healthcare. I say equities take a breather. Oh, the cut is not retroactive, so no need for Fed to raise the rates in order to offset. Added some SVXY puts and GDX calls on this. I think GDX gets a double boost when DXY runs into resistance @ 94.
Reply