
One of the more entrenched and hackneyed themes in financial markets today is that the implosion of the US housing market will be the final nail in the coffin of the bloated US consumer, thereby condemning America to a significant slowdown or a recession even as the rest of the world ticks merrily along. As noted yesterday, the bond market appears to be pricing in a worst-case outcome, as it is clearly ignoring the inflation story. But what the Nattering Nabobs (or is it the Nattering Nouriels?) of Negativity can’t seem to answer is the question posed above: how can there be a recession when both the corporate and household sector are making so much money?
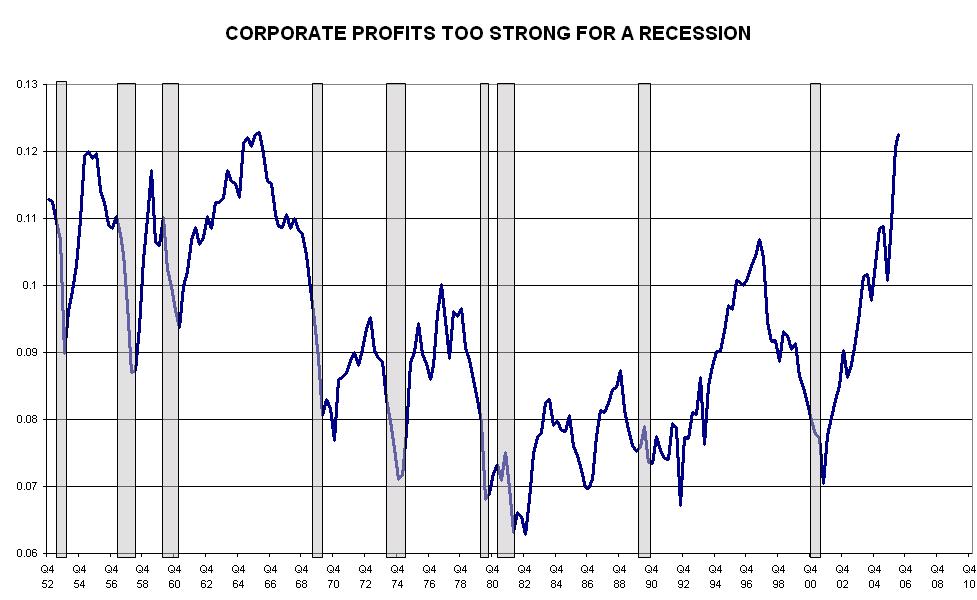
Now we can choose to believe the NIPA profits data, or we can choose to disbelieve it; Macro Man suspects that the NIPA data may be overstated given the recent income revisions, but only modestly so. Certainly the relatively robust earnings growth reported by the S&P 500 for the last 3 years suggests that the trend, if not the level, of the NIPA profits data is spot on. And what the trend says is that things have never been better for the US corporate sector. Margins are good, gearing is light, and on an economy wide basis there has been relatively little inventory buildup relative to sales. Bluntly put, the US economy has never been anywhere close to recession when the corporate sector has had it so good. The chart below illustrates profits as a % of nominal GDP, with recessions in the shaded areas. Typically, profit growth has slowed considerably before the onset of recession, with the nadir in profits coming with the onset of recovery. As things now stand, profit data suggests that a recession isn’t even on the radar.

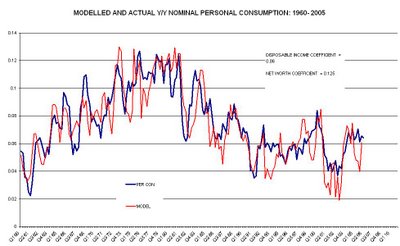
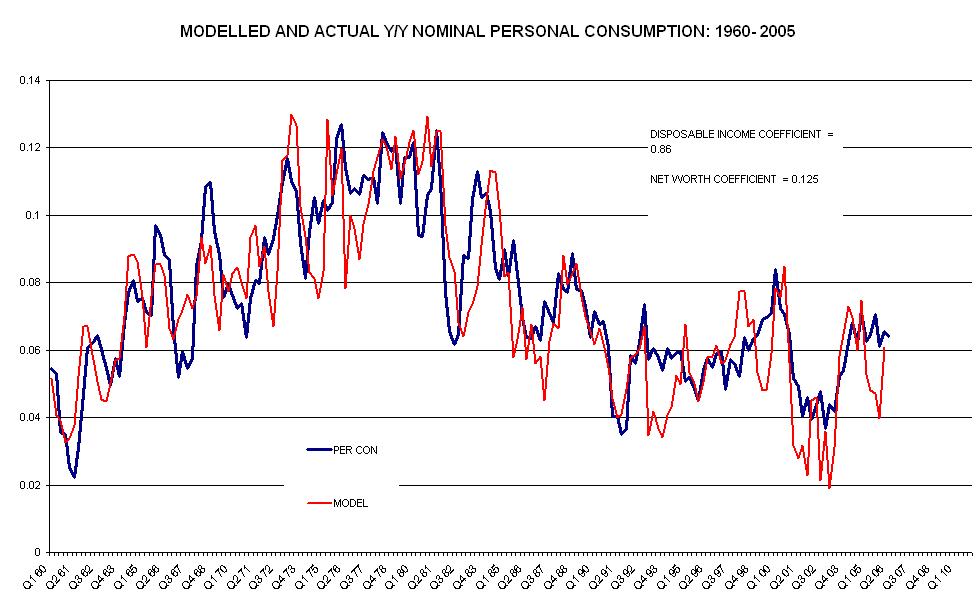
The natural rejoinder is that the crippling blow dealt to the consumer from housing has yet to hit the corporate sector, and once it does the retribution on profits will be terrible and swift. Naturally, this begs the question of what exactly encourages consumers to spend. Is it the tone of the articles in the real estate section of the local newspaper, or is it the amount of cash that breadwinners have left after paying Uncle Sam and the local utilities? History is strongly in favour of the latter. A simple two factor model of consumer spending suggests that disposable income growth is responsible for 85% of spending growth, with changes in household net worth explaining the other 15%. Now, the model suggests that if the consumer was going to get whacked, it should have already happened. In fact, the prospects for consumption are looking better than they did a few quarters ago, thanks to the strong growth in income. While today's retail sales data may have disappointed the consensus, forget not that it came on the heels of a bumper July; Q3 is tracking at 1.2% above Q2. That's a nearly 5% annualized rate it you're scoring at home- hardly a sign of impending doom.
Total personal income is growing 7.3% y/y, profit growth is strong, and inventories are relatively lean. Oh, and the recent decline in gas prices should provide a further boost to disposable income. While it is certainly possible to see a modest period of below trend growth, the risks to what’s currently priced are skewed squarely to the upside. And this doesn’t even take into consideration the likely upward revision to past GDP growth. There is a large discrepancy between the growth suggested by the (more reliable) income data and that in the expenditure figures. Typically, the expenditure data is revised to bring it in line with the income data, which in this case is suggesting real y/y growth of nearly 5% as of Q2.

Bonds yielding 4.75 are an opportunity on a silver platter; Macro Man will sell another 100 TYZ6 on a break of 106-24.
Now we can choose to believe the NIPA profits data, or we can choose to disbelieve it; Macro Man suspects that the NIPA data may be overstated given the recent income revisions, but only modestly so. Certainly the relatively robust earnings growth reported by the S&P 500 for the last 3 years suggests that the trend, if not the level, of the NIPA profits data is spot on. And what the trend says is that things have never been better for the US corporate sector. Margins are good, gearing is light, and on an economy wide basis there has been relatively little inventory buildup relative to sales. Bluntly put, the US economy has never been anywhere close to recession when the corporate sector has had it so good. The chart below illustrates profits as a % of nominal GDP, with recessions in the shaded areas. Typically, profit growth has slowed considerably before the onset of recession, with the nadir in profits coming with the onset of recovery. As things now stand, profit data suggests that a recession isn’t even on the radar.
The natural rejoinder is that the crippling blow dealt to the consumer from housing has yet to hit the corporate sector, and once it does the retribution on profits will be terrible and swift. Naturally, this begs the question of what exactly encourages consumers to spend. Is it the tone of the articles in the real estate section of the local newspaper, or is it the amount of cash that breadwinners have left after paying Uncle Sam and the local utilities? History is strongly in favour of the latter. A simple two factor model of consumer spending suggests that disposable income growth is responsible for 85% of spending growth, with changes in household net worth explaining the other 15%. Now, the model suggests that if the consumer was going to get whacked, it should have already happened. In fact, the prospects for consumption are looking better than they did a few quarters ago, thanks to the strong growth in income. While today's retail sales data may have disappointed the consensus, forget not that it came on the heels of a bumper July; Q3 is tracking at 1.2% above Q2. That's a nearly 5% annualized rate it you're scoring at home- hardly a sign of impending doom.
Total personal income is growing 7.3% y/y, profit growth is strong, and inventories are relatively lean. Oh, and the recent decline in gas prices should provide a further boost to disposable income. While it is certainly possible to see a modest period of below trend growth, the risks to what’s currently priced are skewed squarely to the upside. And this doesn’t even take into consideration the likely upward revision to past GDP growth. There is a large discrepancy between the growth suggested by the (more reliable) income data and that in the expenditure figures. Typically, the expenditure data is revised to bring it in line with the income data, which in this case is suggesting real y/y growth of nearly 5% as of Q2.

Bonds yielding 4.75 are an opportunity on a silver platter; Macro Man will sell another 100 TYZ6 on a break of 106-24.