

No doubt you’ve read something about the flattening of the yield curve. You may have even heard it inverted. I can always tell when an arcane financial concepts hit the mainstream by when my relatives ask me about it. I’ve gotten that one a few times lately.
But let's take that question at face value. Let’s put aside curve inversion for a moment. What does a *flattening* yield curve mean for monetary policy and the economy?
Mohamed got me thinking about that question this afternoon:
The biggest story in financial markets over the past year is not the inversion of the US yield curve, but the bull flattening of the bund curve: here is a chart of Germany 5y/30y slope vs. assets on the ECB balance sheet:

The end of the ECB’s asset purchase program coincided quite closely with a slowdown in global growth that resulted in the bull flattening of the 5y/30y bund curve. What does that mean? Slowing growth--but also little optimism for a pickup in growth or inflation in the future. Combine that with the factors Mohamed mentioned and you have the recipe for a very big bull flattening.
Fast forward to the next ECB meeting. How should monetary policy react? Traditionally, as growth slows monetary policy eases, either through rate cuts, or more recently, asset purchases. You can see that clearly in the chart above in 2015 and heck, right through to 2017.
The flattening in 2014 and again in 2016 both reversed out quite nicely--the first time the result of increased QE from the ECB, and the second time after global growth recovered from the nadir of China growth fears and low oil prices in early 2016.
Where does that leave the ECB today? In a heap of trouble. They need to steepen the curve.
Among the myriad problems in Europe are their banks. The flat curves, low growth, and regulatory constraints have strangled big European banks. Look at this chart of return on equity in European banks vs. US banks:

Sources: Bloomberg, Federal Reserve Bank of St. Louis (FRED)
A flat curve means that banks can’t borrow low (from depositors) and lend high (to borrowers). They have to rely on credit spreads or simply do nothing at all and make money off fees. When banks can’t make money on lending, credit growth suffers. A similar chart of US vs. European credit growth would show a similar dissonance between the US and Europe.
The ECB must find a way to steepen yield curves. How can they do it? Easing monetary policy *must* be a signal for higher growth and inflation, otherwise it is ineffective and most likely counterproductive. If the ECB believes further easing won’t steepen yield curves, they should say so explicitly and tell the government this is their problem now.
That would lead to an easing of fiscal policy--via issuing more long end bonds. That would give Mohamed the supply he so desperately wants for his friends at Allianz.
Now, let's contrast the situation in Europe with what we see in the US:
By way of example, look what happened back in 2007: when the Fed started cutting rates, the 5/30y UST spread started to steepen--as one would expect if monetary stimulus coinciding with the end of the business cycle leads to higher growth in the future (the vertical line coincides with the first cut from the Fed).
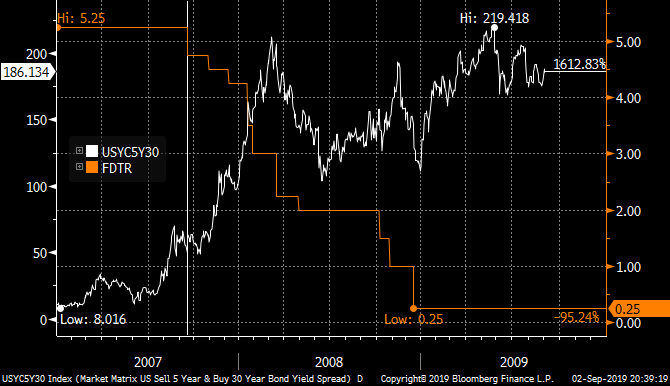
Throughout 2008, the curve stayed steep...going over 200bps in mid 2009. The first round of QE
Steepened the curve even more: 5y/30y spread topped out at over 250bps in 2010.
That was very supportive for credit growth--which is one of monetary policy’s core transmission mechanisms.
Now, looking at the situation today: here is the same chart, 5y/30y ust spread and the fed funds rate.
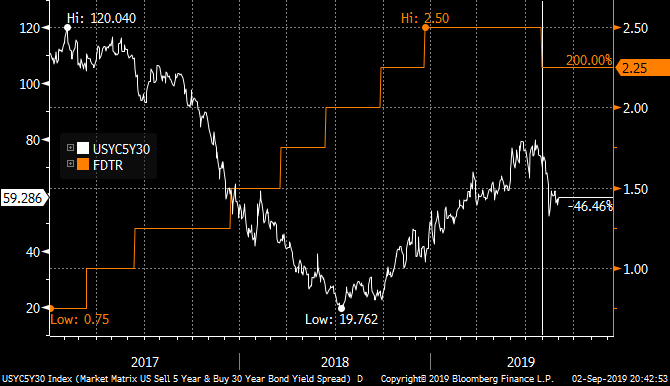
This time, the curve FLATTENED when the Fed started cutting rates.
The market is telling the fed and the ECB that they don’t believe the traditional monetary policy transmission mechanisms work anymore.
Do you believe the market has that right? The market opportunity is clear---bet on further flattening and stagnation if monetary policy is broken--bet on steepening if you think a combination of normal business cycle re-ignition and Fed and ECB easing can sort this out and return growth to trend.
My take: I think the market has gotten way out ahead of itself and is trading on 1) fear and 2) momentum. Real money guys benchmarked to indexes--who happen to be getting eaten alive by passive indexation--caught on to the rally in the front end, but have reacted by buying long end duration and convexity. They are going to stay long until proven otherwise. Nobody wants to be left behind in the great bond rally of 2019.
Now, put on your behavioral finance hat. If you have skin in the game, ask yourself or your colleagues these types of questions:
- What is the probability the US and/or European governments pass fiscal stimulus packages of at least 2%/GDP per annum?
- What is the probability that US and European monetary policy will prove ineffective over the next year--as demonstrated by a 5/30y curves in US and Germany flatter 1 year from now vs. where they are today?
- How much of this is Soros-esque reflexivity, reflecting the “fear of fear itself” and a self-fulfilling prophecy of lower long-term interest rates? If you buy into that--what evidence can you bring to the table?
- Curves have re-steepened in the past--prove to me why this time is different.
These are the type of questions that can get us past rank speculation and productive discussions about what is baked into the markets and how we can exploit that to generate alpha.
skewrisk@gmail.com
@EMinflationista
skewrisk@gmail.com
@EMinflationista
222 comments
Click here for comments «Oldest ‹Older 201 – 222 of 222 Newer› Newest»I needed to see and read this post today and smile.
ReplyGreat question—flattening can signal that markets expect slower growth or that rate hikes are already priced in. It may also suggest reduced policy effectiveness, especially if long-term rates stop rising. I’m curious, could this be a sign the Fed’s tools are losing impact, or just a normal late-cycle signal?
ReplyFrom: London Medium
Interesting
ReplyMicro Link Site
ReplyThere are 2 separate known species of African Grey which are the Congo African Grey Parrot and the Timneh African Grey. https://greyafricanparrotforsale.com/
ReplyThere are 2 separate known species of African Grey which are the Congo African Grey Parrot and the Timneh African Grey.. African grey parrots
ReplyVery value able post, I read the whole story when I start reading it.
ReplyI appreciate your post thanks for sharing the information.
ReplyExcellent article! This is my first time visiting here. I found so many entertaining things in your blog, especially the discussion. From the numerous comments on your articles,Buy Prescription Medications Online I guess I'm not the only one enjoying all the leisure here! Keep up the good., and you have given me an idea.
ReplyA modern industrial mixer machine isn't just a piece of equipment—it's a productivity powerhouse. Partnering with a trusted brand like Tipco Engineering for long-term reliability.
ReplyThanks for taking the time to discuss this.
ReplyNice Blog. Thanks for sharing with us. Such amazing information.
ReplyGreate article. Keep writing such kind of info on your page.
ReplyIm really impressed by it.
Your writing is perfect and complete.
ReplyVery good written information.
ReplyRemarkable! Its really amazing post, I have got much clear idea on the topic of from this post.
ReplyChoose Axcel Gases, a reliable helium gas cylinder manufacturer in Delhi NCR, known for quality cylinders, secure filling, and dependable service for industrial and commercial needs.
ReplyYou are an excellent blogger. I subscribed to your feed and am eager to read more of your excellent posts.
ReplyInformation on outstanding travel spots is well-informed. The pleasant places mentioned were good information.
ReplyYour work was outstanding. The information was well-written and quite helpful. continue recording
ReplyThank you for sharing this with us, please also check out Clean Carts they are also good.
ReplyFryd Carts
Boutiq Carts
The keyword Muha Meds 100 pack is definitely gaining attention among users looking for bulk options with better value. One thing worth highlighting is how important it is to verify authenticity before purchasing, since this product category often faces issues with counterfeits. A genuine Muha Meds 100 pack can offer convenience and cost efficiency, especially for regular users, but quality and safety should always come first. Thanks for sharing useful insights—looking forward to more detailed content like this!
Reply